
Budget variance analysis is the process of comparing your actual financial results against your budgeted figures to spot where reality diverged from the plan. It matters because it turns raw accounting data into a decision tool: you look at both the dollar gap and the percent gap, because materiality and scale tell you different things, and together they flag problems early enough to fix them.
TL;DR:
- Materiality thresholds should combine percentage and dollar impact to avoid overlooking large dollar lines or being overwhelmed by tiny accounts.
- Comparing static versus flexible budgets helps isolate whether cost overruns are due to price changes or volume increases, especially in multi-product businesses.
- Running variance reviews monthly with a clear, concise template and assigned owners ensures timely action and prevents recurring issues from being ignored.
- Small, uncontrollable, or one-time variances typically require monitoring, while controllable or structural ones demand immediate corrective measures or reforecasting.
- Automating the mechanical calculation of variances frees analysts for interpretation, but final decisions on classification and action should remain manual.
Table of Contents
- What Is Budget Variance Analysis and When Should You Use It?
- What Are the Main Types of Budget Variances?
- How Do You Calculate a Budget Variance?
- How Do Flexible Budgets Isolate the Real Cause of a Variance?
- How Often Should You Run a Variance Review?
- How Do You Decide What to Do With a Variance?
- Where Does Automation Fit in Variance Analysis?
- What Actually Separates a Good Variance Program From a Weak One?
- Sources
- FAQ
What Is Budget Variance Analysis and When Should You Use It?
At its core, budget variance analysis compares what you actually spent or earned against what you planned, then asks why the gap exists. That “why” is the whole point. A number without an explanation just sits on a report; a number with a root cause turns into a decision.
You’ll usually compare actuals against one of two baselines: a static budget (the original plan, untouched all year) or a flexible budget (the plan adjusted for actual activity levels, like volume or headcount). Static comparisons work fine when your revenue and costs are stable. Flexible comparisons matter more when volume swings, because they separate “we sold more than expected” from “we spent inefficiently.”
Finance teams lean on this analysis in a few recurring moments:
- Monthly close review, where you check whether the month played out as planned before you finalize reporting.
- Management reporting, where leadership needs a fast read on which categories need attention.
- Reforecast triggers, where a variance is large enough that the original budget no longer reflects reality.
A healthy variance program does two things over time. It builds accountability, because owners know their numbers get reviewed on a schedule. And it sharpens your forecasting, since each cycle of comparing plan to actual teaches you where your assumptions were off.
What Are the Main Types of Budget Variances?
Not every variance means the same thing, and the label “favorable” can be misleading if you apply it carelessly. A favorable variance on a revenue line means you earned more than planned. A favorable variance on an expense line means you spent less than planned. Flip the direction on either side and you get “unfavorable.” The mistake most new analysts make is assuming favorable always means good. Underspending on marketing might be favorable on paper and still cost you a quarter of missed pipeline.
For revenue, the standard decomposition splits the variance into price, volume, and mix. Price variance captures the effect of selling at a different price than planned. Volume variance captures the effect of selling more or less. Mix variance, relevant for multi-product businesses, captures what happens when your product mix shifts even if total volume matches the plan.
For costs, you break variances down similarly: price (did you pay more per unit), efficiency (did you use more inputs than planned), and volume (did activity levels change), layered against fixed versus variable classification.
Beyond the number itself, classify every variance along four lines:
- Timing: the money moved to a different period than planned.
- Structural: a lasting shift, like a permanent rate increase.
- One-time: a single event unlikely to repeat.
- Controllable versus uncontrollable: whether the owner could have influenced the outcome.
How Do You Calculate a Budget Variance?
The formulas are simple enough to do in your head for small numbers, but running them consistently across every line item is where the discipline pays off.
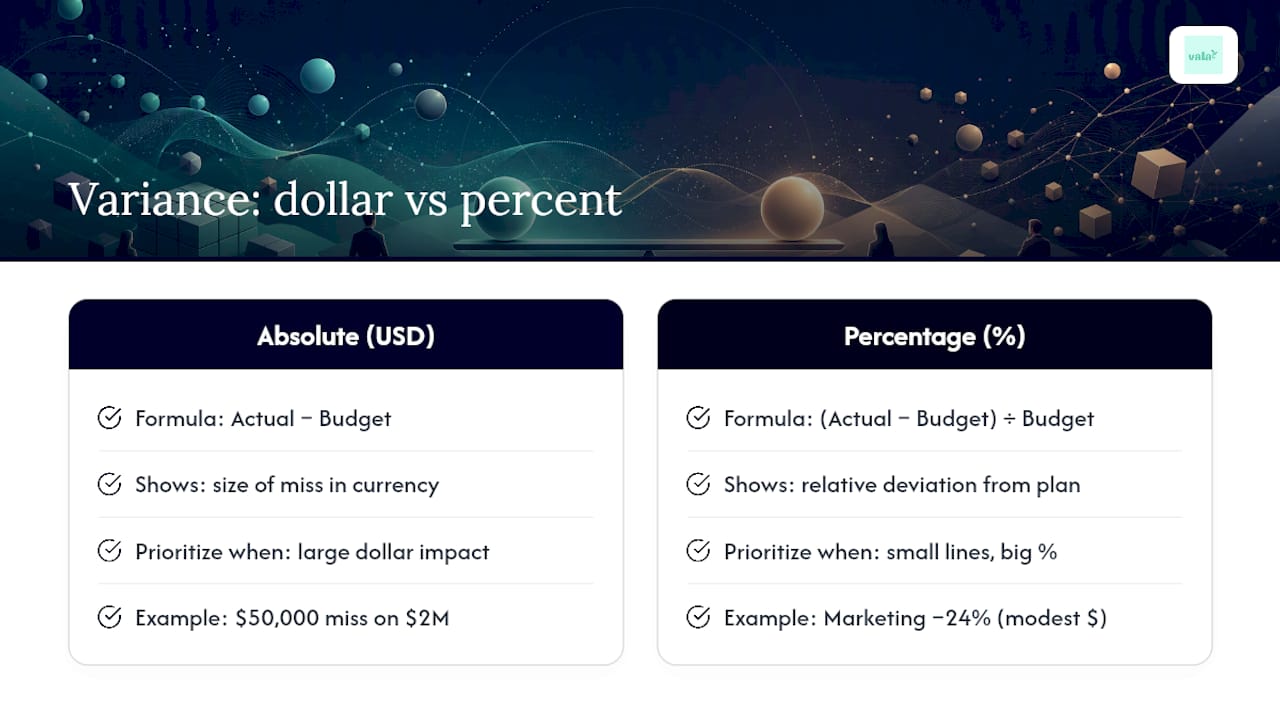
Absolute (dollar) variance = Actual − Budget
Percentage variance = (Actual − Budget) ÷ Budget
Dollar variance tells you the size of the miss in real currency. Percentage variance tells you how far off you were relative to what you planned. You need both, because a $2,000 miss on a $10,000 line is a big percentage swing but a small dollar one, while a $50,000 miss on a $2 million line is a tiny percentage but a number leadership will ask about immediately.
Here’s a simplified monthly example:
Pro Tip: Sort your variance report by dollar impact first, then scan percent variance for smaller line items you might otherwise skip. Ranking by dollar impact keeps you focused on what actually moves the bottom line, while the percent column catches a line like Marketing here: a 24% swing worth investigating even though the dollar amount is modest next to Revenue or COGS.
Marketing underspent by nearly a quarter, which could mean discipline or could mean a paused campaign that will hurt next quarter’s pipeline. Salaries barely moved. Each number needs its own follow-up question.
How Do Flexible Budgets Isolate the Real Cause of a Variance?
A static budget can’t tell you whether a cost overrun came from paying more per unit or simply doing more volume. A flexible budget solves that by recalculating what you should have spent at the actual activity level, then comparing that adjusted figure to what you actually spent.
Building one takes a few steps:
- Pick an activity driver: units sold, hours worked, transactions processed, whatever scales your costs.
- Recalculate variable costs at the actual activity level, holding fixed costs constant.
- Compare actual results to this flexed figure, not the original static number.
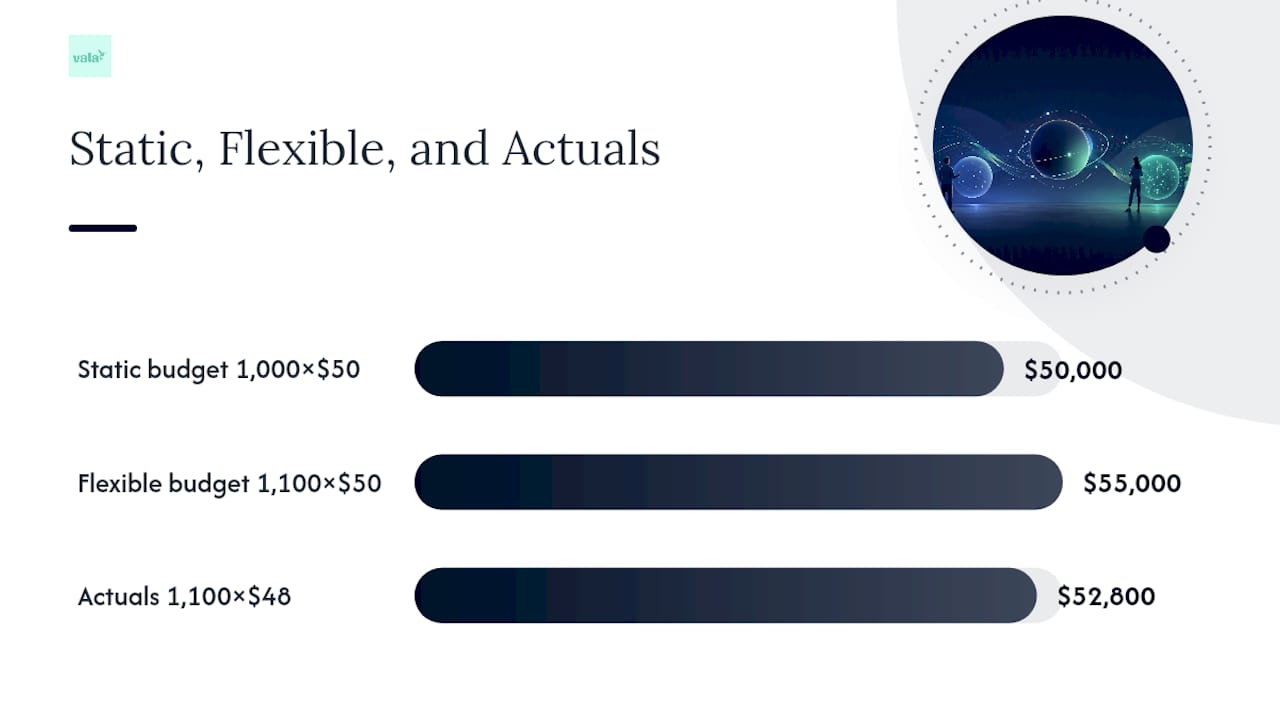
Presenting the static budget, the flexible budget, and actuals side by side is the clearest way to show a reviewer exactly where a variance came from.
For a single product, this mostly isolates volume from rate. For multi-product businesses, you add mix variance on top, since selling more of your lower-margin product while holding total units flat will show up as a favorable volume variance and an unfavorable mix variance at the same time. A quick illustration: if you budgeted 1,000 units at $50 revenue each ($50,000) but sold 1,100 units at $48, your volume variance is positive (+100 units × $50 = +$5,000) while your price variance is negative (100 units of underpricing at $2 × 1,100 = actually calculated as (Actual price − Budget price) × Actual volume = −$2,200).
How Often Should You Run a Variance Review?
Cadence matters as much as accuracy. Most finance teams run their primary review during the monthly close, then bring a summarized version to leadership a few days later once root causes are attached. Waiting longer than a month to catch a structural variance usually means you’ve already absorbed a quarter of unnecessary cost.
Set your materiality threshold using an AND rule rather than a single cutoff. Combining a percentage test with a dollar test stops you from either drowning in noise from tiny accounts or ignoring a large-dollar line that only moved by 2%.
A workable variance report template includes:
- Category and line item name.
- Month-to-date and year-to-date figures, in both dollars and percent.
- Prior-year comparison for context.
- Latest forecast, not just the original budget.
- Root cause, once identified.
- Assigned owner and due date for any follow-up action.
Pro Tip: Keep the review itself to about 30 minutes. A tight, repeatable review ritual that covers your top five or six variances and assigns next steps beats an exhaustive line-by-line audit that burns an afternoon and produces no decisions.
When a variance is structural rather than a one-time blip, that’s your trigger to reforecast rather than just noting it and moving on. A driver-based rolling forecast updates faster than an annual budget and keeps your comparisons relevant to current conditions instead of assumptions made a year ago. For teams weighing when a forecast update makes more sense than sticking with the original plan, comparing budget to forecast approaches is worth a closer look.
How Do You Decide What to Do With a Variance?
Finding a variance is only half the job. The other half is deciding whether it needs a shrug, a phone call, or a full reforecast.
Start with root-cause techniques that don’t require a data science degree:
- 5-Why: ask “why” five times until you hit an actual cause instead of a symptom.
- Price/volume split: isolate whether the miss came from rate or quantity before you assign blame.
- Supplier or contract checks: many cost variances trace back to a renegotiated rate or a missed contract escalation clause.
From there, apply a simple decision rule. Small, one-time, uncontrollable variances usually just need monitoring. Controllable variances above your threshold need immediate corrective action from the line owner. Structural variances, the kind likely to repeat next month, need a reforecast so your plan reflects the new reality instead of chasing an outdated number.
Keep a disposition log of every material variance and what happened to it. Without one, you’ll investigate the same recurring overage three months in a row because nobody remembers it was already explained in February.
Where Does Automation Fit in Variance Analysis?
Automation handles the mechanical part well: pulling actuals, calculating dollar and percent variance, and flagging outliers against your thresholds. Technology can take on that repetitive calculation work, freeing analysts to spend their time on interpretation instead of spreadsheet formulas.
Vala’s AI-driven expense analysis applies that same logic to personal and household budgets, surfacing category drift and recurring subscription creep before they compound. Automation should surface likely causes and suggested decompositions, but finance still owns the final call on classification and what happens next.
What Actually Separates a Good Variance Program From a Weak One?
Chasing every line item to the penny burns time without improving decisions. The finance teams that get real value from this work pick their top variances by dollar impact, assign an owner, and move on. Concise, repeatable reviews beat exhaustive audits almost every time, because a decision made this month is worth more than a perfectly explained variance made three months late.
— SaverStride
Sources
- Variance Analysis | Definition, Types & Processes
- How to Calculate a Budget Variance Analysis (With Formulas)
- Variance Analysis: Budget to Actuals in 5 Steps | BPR Global
- Budget Variance Analysis: Formula, Examples, and How to Read a Budget vs Actual Report | Do The Calculation
FAQ
How Do You Calculate a Budget Variance?
Subtract the budgeted amount from the actual amount to get the dollar variance, then divide that dollar variance by the budget to get the percentage variance. Reviewing both together shows you the size of the miss and its relative significance.
What Is an Example of a Variance Analysis?
If you budgeted $50,000 for marketing and spent $38,000, your dollar variance is negative $12,000 and your percentage variance is negative 24%. From there you’d investigate whether the underspend was intentional discipline or a paused campaign that could hurt future pipeline.
Is It Good to Have a Budget Variance?
It depends on the direction and the line item: a favorable variance on revenue is good, but a favorable variance from underspending on a growth-driving category like marketing can signal a missed opportunity rather than success.
What Are the Three Types of Variances?
The most common framework splits variances into price, volume, and mix for revenue, or price, efficiency, and volume for costs, though teams also classify variances as timing, structural, one-time, or controllable versus uncontrollable depending on the analysis they need.