
Expense insights are saved, pre-built analytics queries that automatically group your transactions, compute totals, and surface spending patterns in near real time. Three things define how they work: (1) they refresh as transactions change — every edit, approval, or new import recalculates the card instantly; (2) their accuracy depends entirely on categorization and data model quality; and (3) AI layers on top to add forecasts, anomaly flags, and plain-language explanations that plain aggregations cannot produce.
- Insights stay current without you rerunning anything — the query is always live.
- Garbage categories produce garbage insights; fixing one merchant match can correct an entire month’s breakdown.
- AI outputs (summaries, anomalies, forecasts) are built on the same grouped data, just interpreted by a model.
Table of Contents
- How do expense insights actually work?
- What does AI add to your expense insights?
- What insight cards and metrics will you actually see?
- How can you get more reliable insights from your app?
- What are the limits of expense insights, and how do you verify them?
- How Vala puts expense insights to work for you
- Key Takeaways
- When should you trust automated insights — and when should you check?
- See your spending clearly with Vala
- Useful sources
How do expense insights actually work?
Every insight card you see is the output of a five-step pipeline running behind the scenes.
Data ingest is where it starts. Your bank and credit card feeds sync automatically, manual entries fill the gaps, and shared group items get tagged to specific members. All of that raw data flows into a single ledger.
Normalization cleans the mess. Raw bank descriptions are inconsistent — the same coffee shop might appear as “SQ *BLUESTONE LN,” “BLUESTONE LANE NYC,” or a truncated string. The app standardizes merchant text, attaches timestamps, and normalizes any currency differences so every record is comparable.
Categorization is the most consequential step. Transaction categorization maps those cleaned descriptions to spending categories — groceries, dining, transport, subscriptions — using a combination of machine learning and rules, often with a confidence score attached. A high-confidence match goes straight through; a low-confidence one may surface for your review.

Aggregation is where the insight card is actually built. Grouping operators like group-by:category, group-by:merchant, and group-by:month compute totals and counts, then rank groups by value. A simple monthly category drift query combines group-by:month with group-by:category to show you exactly where spending shifted.
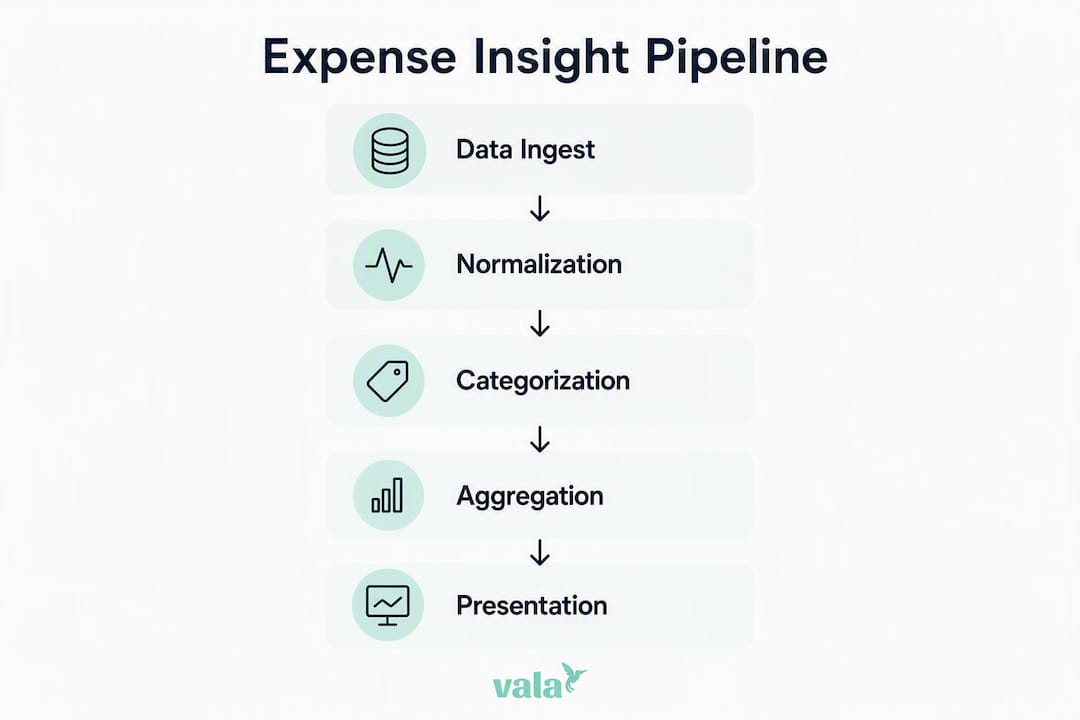
Presentation delivers the result as a card, chart, or drilldown. The query stays live, so the card updates the moment a new transaction posts or you correct a category.
| Pipeline Step | What Happens | What You Can Influence |
|---|---|---|
| Data ingest | Bank/card feeds sync; manual entries added | Connect all accounts; add receipts promptly |
| Normalization | Merchant text cleaned; timestamps attached | Correct merchant names when misread |
| Categorization | ML + rules map transactions to categories | Recategorize mismatches; teach the model |
| Aggregation | Totals, counts, and rankings computed by dimension | Set consistent “who” tags for group members |
| Presentation | Live insight card rendered; drilldown available | Drill into any group to verify the numbers |
A reliable data model separates aggregatable facts (dollar amounts) from contextual entities (items, reports, timestamps). Without consistent “who” and “date” fields, the aggregations lose meaning fast.
What does AI add to your expense insights?
Plain aggregations tell you what happened. AI tells you why and what’s coming.
- Summary generation: A short natural-language highlight like “Groceries up 18% vs. last month” appears at the top of the card, pulling the most significant trend so you don’t have to scan a table.
- Anomaly detection: The model flags unusual spikes or out-of-pattern items and surfaces the likely cause — a specific merchant, a time cluster, or a single group member. AI-powered anomaly detection catches what manual review misses.
- Forecasting: Short-term projections use your historical patterns and seasonal signals to estimate where a category is heading. Zoho Expense documents AI features that forecast future expenses and visualize trends as charts.
- Spending explainers: The AI decomposes a change versus a rolling baseline and links directly to the supporting transactions, so you can verify the claim in two taps.
All four features sit on top of the same grouped aggregations used for basic insights. The AI is an interpretation layer, not a separate data source.
Pro Tip: Some AI features — including forecasting and advanced anomaly detection — may need to be enabled in your app’s settings before they appear on your dashboard. Check your notification and AI preferences if a feature you expect isn’t showing up.
What insight cards and metrics will you actually see?
Recognizing the standard card types helps you use them correctly instead of misreading what they show.
| Insight Card | Key Metric | Useful For | Dimensions That Power It |
|---|---|---|---|
| Period total | Total spend for month/week/quarter | Budget pacing, month-end check | Time, person |
| Category breakdown | Spend per category, ranked | Spotting category drift, finding leaks | Category, time |
| Top merchants | Highest-spend vendors | Identifying subscriptions, duplicate charges | Merchant, time |
| Status breakdown | Submitted / approved / reimbursed counts | Tracking reimbursements in shared groups | Status, person |
| vs. Budget | Actual vs. budgeted per category | Enforcing shared-budget limits | Category, budget baseline |
| Per-person split | Each member’s share of group spend | Fairness checks, group reconciliation | Person (who), time |
| Month-over-month change | % change vs. prior period | Catching unexpected spending jumps | Time, category or merchant |
Common analytics views include period totals, status breakdowns, and actual-vs.-budget comparisons. The per-person split card is especially useful for couples or small groups where one member’s spending can quietly skew the whole picture.
How can you get more reliable insights from your app?
Better inputs produce better outputs. These five steps make the biggest difference.
- Connect and authorize all bank and credit card feeds. Missing accounts create blind spots. A partial picture produces misleading totals.
- Confirm and correct category mappings. Review auto-assigned categories for the first two weeks after connecting an account. Expense categorization accuracy improves significantly once you correct the early mismatches.
- Set budgets and comparison baselines. Without a baseline, the vs.-budget card has nothing to compare against. Even a rough monthly target per category is enough to activate the comparison view.
- Enable shared-group tagging. Assign a “who” field to each member so the per-person split and top-spender cards stay meaningful across periods.
- Reconcile receipts and approve transactions. Status fields only populate when transactions move through the workflow. Unreconciled items skew status breakdowns and reimbursement tracking.
Example: Say your app keeps categorizing a local gym as “Health & Fitness” one month and “Subscriptions” the next. Correcting that merchant match once teaches the model. The category-breakdown card for every prior month that included that merchant recalculates automatically.
Pro Tip: Use custom tags for recurring shared costs — a road trip, a joint subscription, a group dinner — so you can filter insights by event without disrupting your main category structure.
What are the limits of expense insights, and how do you verify them?
Insights can mislead you in a few specific ways. Knowing the failure modes helps you catch them before acting.
The most common pitfalls: miscategorized transactions inflate the wrong category; missing bank connections leave whole accounts out of totals; multi-currency transactions distort period comparisons if exchange rates aren’t normalized; and timing mismatches between transaction date and settlement date can make a charge appear in the wrong month.
When a number looks off, open the drilldown. Grouped insights rank groups by value and let you expand any group to see the individual transactions behind it. Check the “who” filter and the time range first — a wrong date filter is the most common reason a total looks wrong. Then reconcile any suspicious spike against your actual bank statement or receipt.
On privacy: before enabling group insights, review your app’s bank-connection permissions and sharing settings. Understand exactly which members can see which transactions, especially in a shared household or friend group where some spending is personal.
Pro Tip: Treat any insight that would drive a big decision — canceling a service, reallocating a joint budget, or making a large transfer — as a hypothesis, not a verdict. Drill down to the supporting transactions before you act.
How Vala puts expense insights to work for you
Valapoint’s Vala app walks you through the full insight flow in a few taps. The dashboard shows insight cards for your connected accounts. Tap any card to expand the grouped view, sorted by value. Tap a group to see the individual transactions behind it. Open any transaction to view the receipt, edit the category, or correct the “who” field — and watch the insight card recalculate immediately.
Trust signals built into the experience: insights refresh in real time as transactions post, edits are logged in an audit trail, and bank-connection permissions are clearly displayed so you always know what data is being accessed. For couples and groups, Vala assigns a consistent “who” dimension to each member, handles split items with share tags, and supports per-member budgets so the top-spender card stays accurate across people and periods. Real-time group tracking is built into the core experience, not an add-on.
Pro Tip: After connecting your first account, correct one miscategorized transaction and watch the category breakdown card update. That single action shows you exactly how the insight pipeline responds to better data.
Key Takeaways
Expense insights are only as reliable as the data feeding them — connect every account, fix categories early, and always verify big signals with a drilldown before acting.
| Point | Details |
|---|---|
| Insights are live queries | They recalculate automatically as transactions are added, edited, approved, or reimbursed. |
| Categorization drives accuracy | Correcting one merchant match retroactively fixes every insight that included that transaction. |
| AI adds interpretation | Summaries, anomaly flags, and forecasts layer on top of the same grouped data as basic cards. |
| Five steps improve reliability | Connect all accounts, fix categories, set budgets, tag members, and reconcile receipts. |
| Valapoint’s Vala app | Provides real-time insight cards, a full audit trail, and easy recategorization for individuals, couples, and groups. |
When should you trust automated insights — and when should you check?
Automated insights are genuinely useful for routine monitoring. A weekly scan of your top-5 spending categories and any flagged anomalies takes 10–15 minutes and catches most drift before it becomes a real problem. For that kind of regular check-in, the AI’s work is usually good enough to act on directly.
Where I’d push back on full automation: any decision with real financial weight deserves a manual drilldown. Canceling a subscription, reallocating a joint budget, or deciding a category is “under control” based on a single card — those warrant opening the transaction list and confirming the numbers are clean. The insight is a prompt, not a conclusion.
The weekly review habit that works best focuses on two things: flagged anomalies first, then the top-5 spenders by category. Everything else can wait for month-end. That rhythm keeps insights honest without turning personal finance into a second job.
See your spending clearly with Vala
Most people don’t have a spending problem. They have a visibility problem. Vala’s AI-powered insight cards give you a clear, real-time picture of where your money goes — across your own accounts, a shared household, or a group of friends splitting costs.
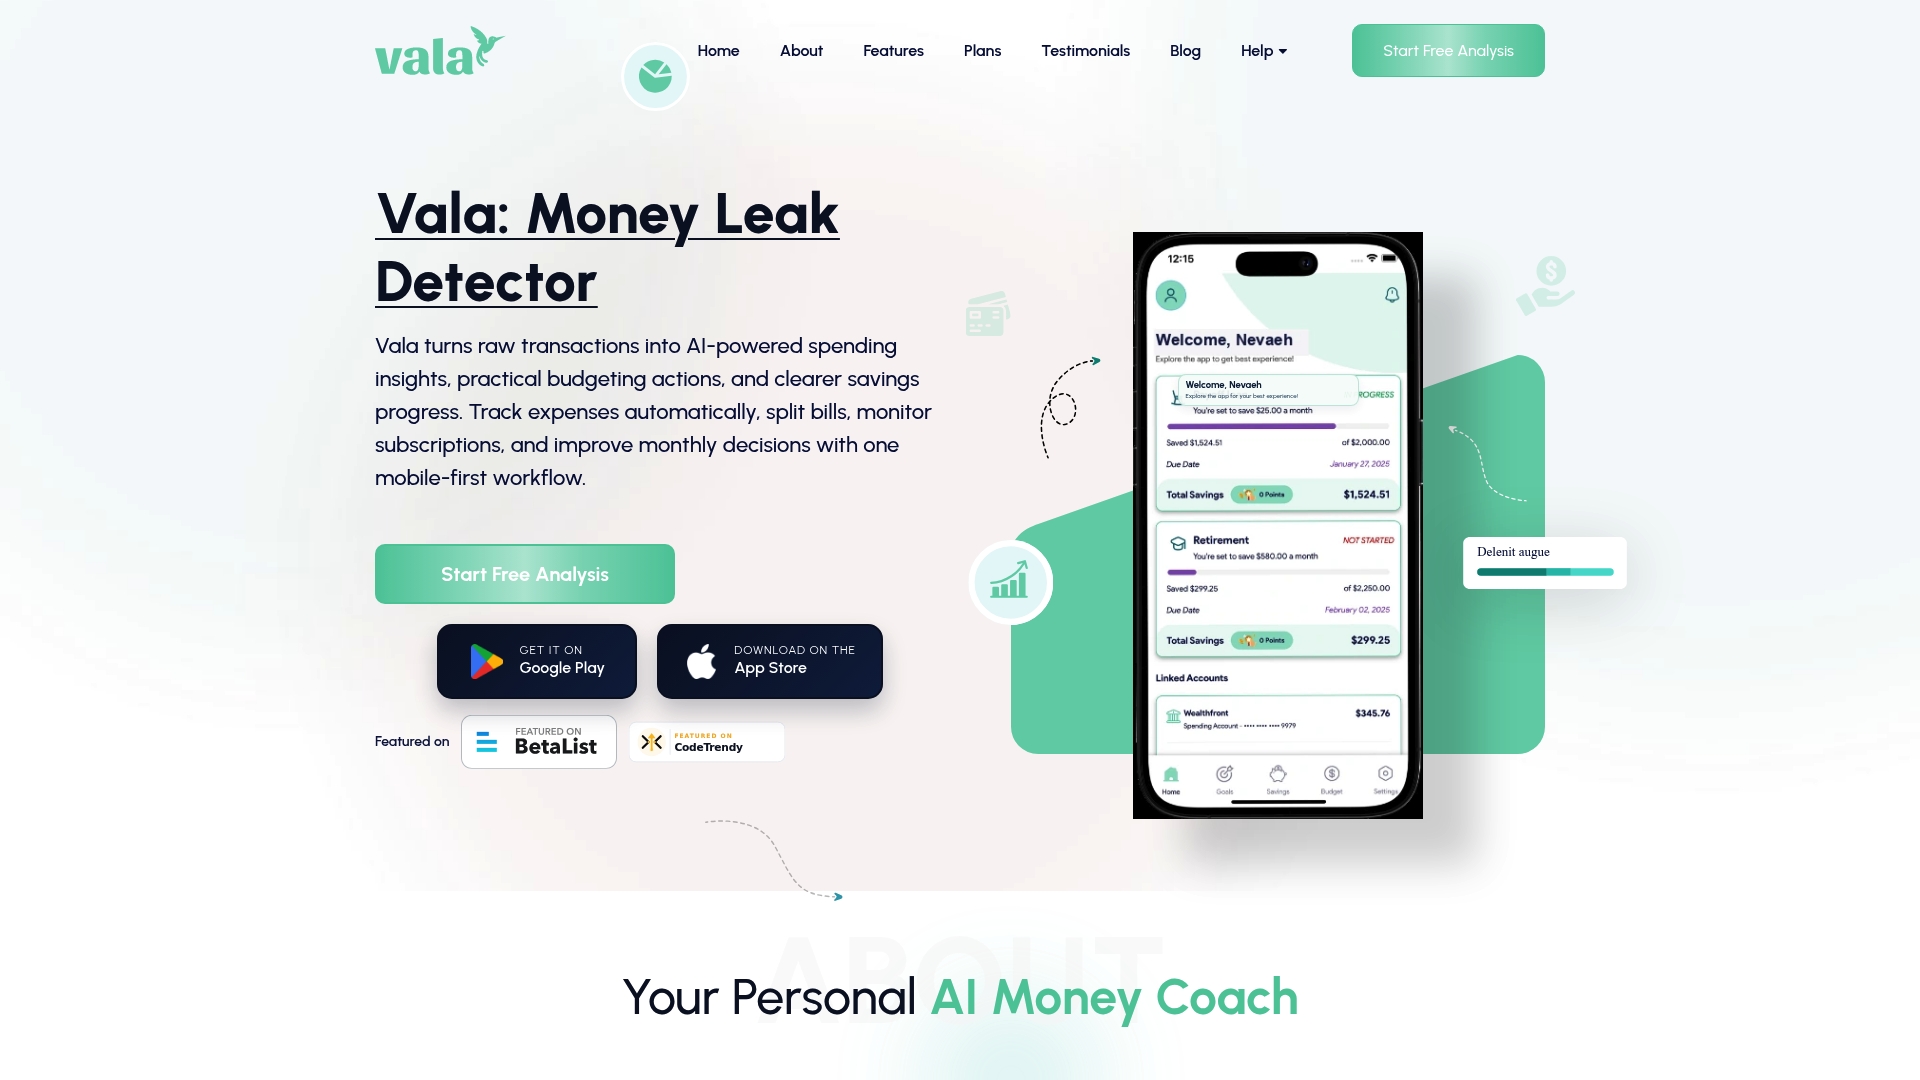
Connect one bank account, correct one category, and your first insight card recalculates in front of you. That’s the fastest way to understand what the data actually shows. Vala’s audit trail, recategorization tools, and secure bank-connection controls mean you’re always in charge of what gets tracked and who sees it. Start with a free account and test your first insight today.
Useful sources
These references cover the technical foundations and practical setup steps behind expense insights.
- How to Use Insights in Expensify — Documents how pre-built insight queries work, grouping operators available, and real-time refresh behavior.
- Expense Analytics | Zoho Expense — Covers AI features including forecasting, anomaly detection, and chart-based visualization.
- AI Features | Zoho Expense — Details which AI features require explicit enablement and early-access availability.
- Automated Transaction Categorization | Fiskil — Explains how raw bank descriptions are mapped to categories with confidence scores.
- Insights Data Model | MXP Help Center — Describes the structured data model that separates aggregatable facts from contextual entities.
- Expense Analytics | Light Help Center — Lists common analytics views including period totals, status breakdowns, and budget comparisons.
- Vala Blog: Expense Tracking Best Practices — Practical habits for consistent tracking and weekly insight reviews.
When following any verification step, open the drilldown or audit trail link in your app directly — reading the transaction list behind a number is always faster than second-guessing the card.