
Spending analysis means collecting your recent transactions, grouping them into categories, and using those groups to spot leaks and set a realistic budget. Start today: export the recent months of transactions from your bank or credit card, or request a CSV file if your bank makes that easier. Several months gives you enough history to catch a pattern without dragging in a full year of noise.
TL;DR:
- Spending analysis should cover three to six months of transactions to balance pattern recognition and avoid outdated habits skewing results.
- Automated tools like Vala can greatly reduce manual effort by extracting, cleaning, and categorizing transaction data, especially across multiple accounts.
- Prioritizing budget fixes involves targeting high-impact, low-effort actions like canceling unused subscriptions for quick savings.
- Small recurring charges and shared expenses are common money leaks often missed without regular review and automation.
- Combining analysis with forecasting helps create realistic budgets, identifying seasonal patterns and upcoming charges to prevent surprises.
Table of Contents
- What Spending Analysis Actually Does for You
- The Five-Step Weekend Workflow
- Choosing the Right Tool for the Job
- Turning Your Numbers Into a Plan
- Real Money Leaks and Why Automation Matters Here
- Fixing Miscategorized Transactions
- Protecting Your Data While You Analyze It
- Building Categories That Actually Fit Your Life
- Using Forecasts to Get Ahead of Future Spending
- Spending Analysis vs. Budgeting: How They Work Together
- The Blind Spot Most People Miss
- Let Vala Handle the Heavy Lifting
- Where to Go Deeper
- Sources
- FAQ
What Spending Analysis Actually Does for You
Spending analysis exists to answer three questions: where does your money actually go, what’s quietly leaking out, and does your budget match reality. It’s different from budgeting, which sets targets going forward; analysis looks backward first, at what you’ve already spent, so your forward-looking budget isn’t a guess.
The Consumer Financial Protection Bureau recommends reviewing several months of checking account and credit card history to build an honest baseline. That word, honest, matters. Most people underestimate discretionary spending by a wide margin until they see it printed in black and white.
You don’t need to do this every week. A full review works well as:
- A one-time deep dive when you’re building your first real budget
- A quarterly checkup to catch new subscriptions or price creep
- A monthly quick scan once your categories are set up
One to six months of history works, but three tends to be the sweet spot. It’s long enough to smooth out one weird month (a wedding, a car repair) but short enough that old habits you’ve already fixed don’t skew the picture.
The Five-Step Weekend Workflow
You can do this in an afternoon. It follows the same core sequence procurement analysts use for corporate spend: extract, cleanse, classify, analyze, act, adapted here for a checking account instead of a supply chain.
1. Extract your transactions. Log into every account you spend from, checking, credit cards, and any shared cards, and export three months of history. Most banks let you download a CSV or Excel file directly. If yours doesn’t, request one through customer service or use your statements as a backup source. Combine everything into a single spreadsheet or import it into an app that accepts bulk uploads.
2. Clean the data. Delete duplicate entries (a common issue if a card was charged and later refunded). Normalize merchant names so “AMZN Mktp US” and “Amazon.com” become one line item. Fix inconsistent date formats and confirm every amount is positive for spending and negative for refunds or income, or vice versa, whichever convention you’re using.
3. Categorize everything. Use a short taxonomy rather than a sprawling one. Four buckets work for most households: fixed (rent, insurance, loan payments), variable (groceries, gas, utilities), discretionary (dining out, entertainment, shopping), and subscriptions (streaming, apps, memberships). A tight taxonomy like this keeps your analysis actionable instead of turning into forty micro-categories nobody reviews twice.
4. Analyze the totals. Add up each category by dollar amount and as a percentage of your income. Flag anything recurring that you don’t immediately recognize, and look for spikes, one month where dining out doubled, a surprise annual renewal.
5. Act on three things. Cancel or renegotiate one recurring charge you don’t need. Set a hard cap on discretionary spending for next month. Automate a small transfer to savings the day after your paycheck lands, before you can spend it.
Pro Tip: Sort your subscriptions by billing date before you cancel anything. Canceling right after a renewal, rather than right before, means you don’t lose money you already paid for that cycle.
Choosing the Right Tool for the Job
Not every spending review needs software. A basic spreadsheet template works fine if you have one or two accounts and a couple of hours to spare. Where tools genuinely earn their keep is at the categorization and detection stage, the part most people find tedious enough to quit halfway through.
Four categories cover most of what’s available:
- Spreadsheet templates — free, flexible, but every categorization is manual
- Budgeting apps — set targets and track against them, lighter on historical analysis
- Automated spending analyzers — import statements and auto-sort transactions using rules
- Bank-integrated insights — built into your existing banking app, limited to that one account
Whatever you choose, look for CSV import, rule-based auto-categorization, recurring-charge detection, exportable reports, and categories you can rename or merge. Bank features like Starling Bank’s spending insights show what good category and merchant breakdowns look like, with date-range comparisons so you can see April against May at a glance.
A spreadsheet is enough if you’re doing a one-time review of a single account. Automation earns its place once you’re juggling multiple accounts, shared expenses, or a recurring monthly habit, since accurate automated classification cuts the manual prep time dramatically compared to hand-sorting hundreds of line items.
Turning Your Numbers Into a Plan
Raw totals don’t mean much on their own. Convert each category into a percentage of income first, that’s what tells you whether $400 on dining out is fine or alarming depending on whether you earn $3,000 or $8,000 a month.
Once you have percentages, prioritize using impact against effort. Fixing your biggest problem first sounds obvious, but it’s usually not the fastest win.
- High impact, low effort: canceling one unused subscription, saves money immediately with zero ongoing work
- High impact, higher effort: renegotiating your cell phone or insurance bill, worth a phone call
- Lower impact, low effort: trimming one discretionary category by 10%
- Lower impact, high effort: overhauling your grocery budget entirely, save this for later
Money Leak Snapshot: Subscription and recurring-charge reviews are consistently one of the fastest wins in a spending analysis, because canceling something takes minutes but the savings repeat every single month without further effort.
Expect visible results in stages: within 30 days you’ll likely cancel one or two subscriptions and notice a smaller discretionary total. By 90 days, your categories will feel routine and you’ll catch price increases before they slide through unnoticed. By 180 days, the habit itself becomes the real savings engine.
Real Money Leaks and Why Automation Matters Here
Manually tracking every transaction across multiple cards and a shared account eats hours. Automation doesn’t replace your judgment, it just removes the repetitive extract-clean-categorize grind so you can spend your fifteen minutes on decisions instead of data entry.
Vala’s spending analysis surfaces the same leaks over and over across real households:
- Duplicate subscriptions billed on two cards after a card refresh or account merge
- Group charges nobody actually uses anymore, split evenly by habit rather than by benefit
- Free trials that quietly convert to paid plans weeks after anyone remembers signing up
These aren’t rare edge cases. They’re the everyday version of the financial leaks that show up in almost every account once someone actually looks. Automated pattern detection, the kind that flags a $14.99 charge appearing on the same date every month under three different merchant names, catches things a manual scan tends to miss simply because it happens every month and blends into the background. This piece was prepared under SaverStride editorial guidance, drawing on Vala’s work helping households detect spending patterns they’d otherwise never notice.
Fixing Miscategorized Transactions
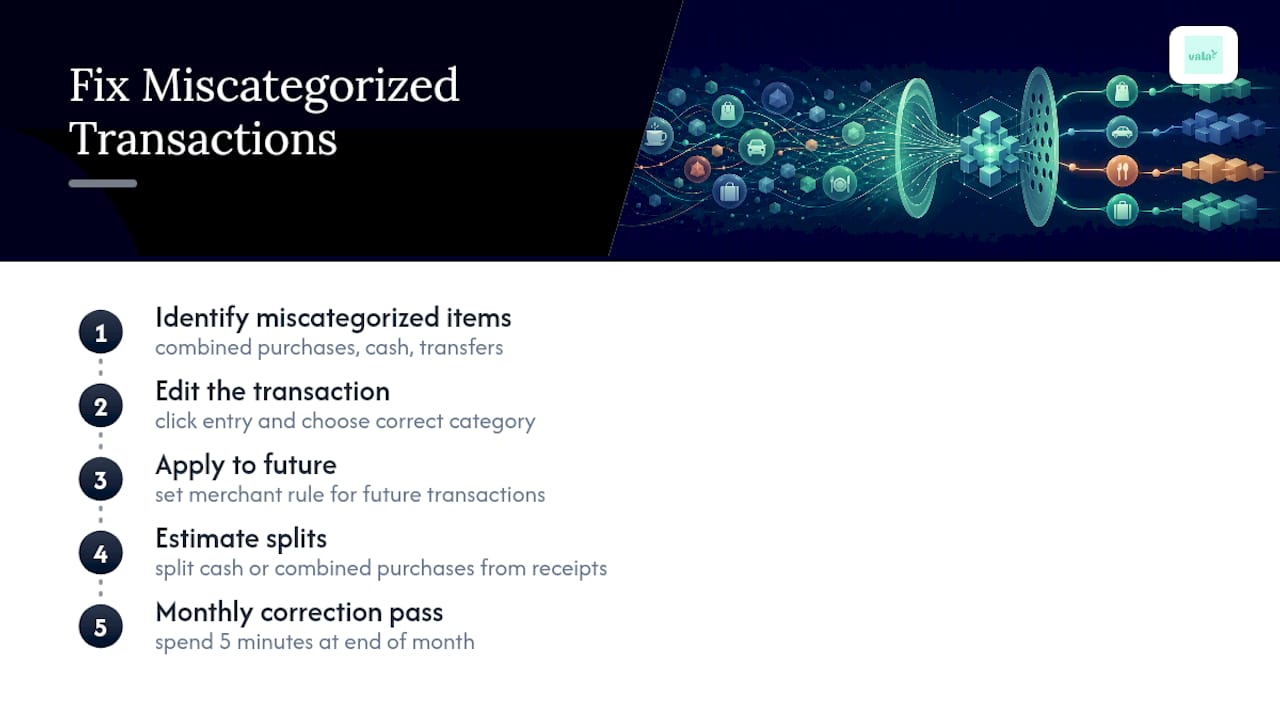
Automatic categorization gets things wrong sometimes, and that’s normal, not a failure of the tool. A grocery store that also sells gas might land in “variable” one month and “fixed” the next. A big-box retailer selling everything from diapers to a television makes any rules engine guess.
When you spot a miscategorized transaction, fix it directly rather than letting it sit. Most tools let you click the entry, reassign the category, and apply that choice to future transactions from the same merchant automatically. That second step matters more than the fix itself: without it, you’re stuck correcting the same Target charge every single month.
Watch for a few recurring problem spots. Combined purchases (Target, Walmart, Costco) often mix categories in a single transaction. Cash withdrawals show up as one lump sum with no detail on what the cash actually paid for, so you may need to estimate a split based on memory or a receipt. Transfers between your own accounts sometimes get miscounted as spending, inflating your totals for no real reason.
Set aside five minutes at the end of your monthly review specifically for corrections. Skipping this step is the single biggest reason people abandon their analysis after two months, the categories stop matching reality and the whole exercise starts feeling pointless. A quick correction pass keeps the picture trustworthy.
Protecting Your Data While You Analyze It
Handing over bank credentials or uploading transaction history means handing over a detailed record of where you live, shop, and spend your money. That’s worth treating carefully, regardless of which method you use.
If you’re using a spreadsheet, keep it somewhere encrypted or password protected, not sitting unprotected in a shared cloud folder. If you’re using an app, check whether it connects to your bank through a read-only link (common with reputable aggregators) rather than storing your actual login credentials. Read-only access means the app can see transactions but can’t move money, which limits what a breach could actually do.

Look for a few concrete signals before trusting any tool with financial data: bank-level encryption, a clear statement about whether your data gets sold to third parties, and the ability to delete your data entirely if you stop using the service. A vague privacy policy that never mentions encryption or data retention is a reason to keep looking.
Multi-factor authentication on the app itself is worth turning on even if it adds a few seconds to your login. Financial data doesn’t need to be exciting to be valuable to someone else. A list of your subscriptions and spending habits is enough to build a convincing scam, so treat access to it the same way you’d treat access to your bank account, because functionally, that’s what it is.
Building Categories That Actually Fit Your Life
Generic categories miss the details that matter to your specific spending. “Entertainment” that lumps together your kid’s soccer league fees and your Friday night takeout tells you nothing useful about either one.
Start with the four core buckets, fixed, variable, discretionary, subscriptions, then split further only where you genuinely spend enough to warrant it. If you spend $600 a month on pet care, that deserves its own line instead of hiding inside “variable.” If you spend $20 a month on parking, it can stay folded into “variable” without losing anything.
A good test: if a category’s total surprises you, split it. If it never surprises you, leave it alone. Categories exist to inform decisions, not to satisfy a sense of tidiness, so resist the urge to build fifteen categories when five will actually get reviewed.
Revisit your categories every few months as your life changes. A new baby, a new city, a new job with a longer commute, all of these shift what deserves its own line item. The goal isn’t a perfect taxonomy on day one. It’s a taxonomy that keeps earning your attention instead of one you build once and ignore.
Using Forecasts to Get Ahead of Future Spending
Past spending is useful mainly because it predicts future spending, not because the history itself matters. Once you have three months of clean, categorized data, you can start projecting forward instead of just looking back.
The simplest forecast is a rolling average. Take your last three months in a category, average them, and treat that number as next month’s expected spending. If your grocery average is $520, budgeting exactly $520 next month is a far better guess than picking a round number out of habit.
Watch for seasonal patterns too. Utility bills spike in summer or winter depending on climate. Gift spending clusters around the holidays. If your three-month window happens to land during a low-spending stretch, your forecast will underestimate what’s coming, so it’s worth glancing at the same months from last year if you have that data available.
Forecasting also flags problems before they hit your account. If a subscription renews annually and you know the date, you can set aside a little each month instead of absorbing the full charge in one shot. That’s the real value of combining analysis with forecasting: it turns spending review from a rearview mirror into something closer to a dashboard.
Spending Analysis vs. Budgeting: How They Work Together
Spending analysis and budgeting solve different problems, and confusing them is why a lot of budgets fail within a month or two. Analysis tells you what happened. Budgeting tells you what should happen next. Skip analysis and your budget is a guess dressed up as a plan.
Here’s how the two connect in practice:
| Aspect | Spending analysis | Budgeting |
|---|---|---|
| Direction | Looks backward at actual transactions | Looks forward at planned spending |
| Question answered | Where did the money go? | Where should the money go? |
| Frequency | One-time deep dive, then periodic checkups | Ongoing, usually monthly |
| Output | Categories, trends, leaks | Targets and limits per category |
A budget built without analysis first tends to set targets that don’t match reality, too optimistic on dining out, too generous on a subscription tier nobody uses anymore. Run the analysis first, let it inform realistic category limits, then use budgeting to hold yourself to those limits going forward. The two aren’t competing methods. Analysis is the diagnosis; budgeting is the treatment plan.
The Blind Spot Most People Miss
Most people focus their spending analysis on the big, obvious categories, rent, groceries, the car payment, and skip past the small stuff entirely. That’s backwards. Small recurring charges, especially the ones split across shared accounts with a partner or roommate, are where the real leaks hide, because nobody’s watching a $9.99 line item closely enough to question it.
The fix isn’t more discipline. It’s a system: set auto-categorization rules once, then schedule a fifteen-minute monthly review instead of a full re-analysis every time. Treat it like a recurring habit, not a one-time project, and the leaks stop reappearing.
— SaverStride
Let Vala Handle the Heavy Lifting
Doing this manually every month works, but it’s the part most people quietly stop doing after the second or third round. Vala automates the extract, clean, and categorize steps for you, then surfaces the specific money leaks, duplicate subscriptions, unused group charges, forgotten free trials, that a manual scroll through statements tends to miss.

Vala’s approach focuses on practical recovery rather than another dashboard to stare at: it reviews recurring charges automatically, splits shared and group expenses without the group-chat math, and gives you real-time insights tied to an actual action you can take, not just a chart. If you want to see where your own leaks are hiding, start with a free Money Leak Check or take the Financial DNA Test to understand your spending style before you dive in. Ready for the automated version, cleaning, categorizing, and recurring-charge review handled for you? Current pricing details are available on the provider’s website at Valapoint.
Where to Go Deeper
For methodology and further reading, the Consumer Financial Protection Bureau’s spending assessment guide walks through building a household baseline. Bill explains the extract, cleanse, and classify sequence in a procurement context that adapts well to personal use. For a look at what modern spend-insight tools can do, see Starling Bank’s spending insights feature, and for a structured challenge approach, the Zero Spend Guide offers a workbook for short-term aggressive saving.
Sources
- Assess your spending — Consumer Financial Protection Bureau
- Bill
- Spend Analysis 101 | Complete Guide for Procurement — Sievo
- Spending Insights — Starling Bank
FAQ
How do I do a spending analysis?
Export three months of transactions from your bank or credit card, clean and merge them into one file, sort them into a small set of categories (fixed, variable, discretionary, subscriptions), then total each category by dollar amount and percentage of income to spot leaks and set a realistic budget.
How can I save $5,000 in three months?
There’s no guaranteed formula, but pairing a spending analysis with aggressive cuts to discretionary categories and automated weekly transfers into savings gives you a realistic shot; canceling recurring charges and capping non-essential spending are usually the fastest levers.
What does “spend analysis” mean?
Spend analysis is the process of collecting, cleaning, and categorizing transaction data to understand where money goes and to identify savings opportunities, a method used across procurement and personal finance alike.
Does Vala do spending analysis automatically?
Yes. Vala automates the extract, clean, and categorize steps and surfaces recurring charges and money leaks in real time, so you get the insights of a manual spending analysis without the weekend spreadsheet work.