Why Income Tracking Matters for Your Financial Health

Income tracking matters because it turns guesswork into decisions you can act on right now. When you know exactly what’s coming in, you can build a budget that actually holds, prepare for tax season without scrambling, and spot problems before they become emergencies.

Here’s what consistent tracking gives you:

  • Budget control: Real numbers replace estimates, so every spending decision is grounded in what you actually earn.
  • Tax readiness: Organized records make filing faster and reduce the stress of matching deposits to 1099s or Schedule C entries.
  • Financial confidence: Knowing your numbers reduces anxiety and helps you make proactive choices instead of reactive ones.

The sections below cover what to track, how to track it, the most common mistakes, and a concrete 30-day plan to get started.

Pro Tip: If you have variable or gig income, tracking is even more valuable than it is for salaried workers. Your income isn’t predictable, so your records have to be.


Table of Contents

1. Why income tracking matters: the real benefits

Tracking your income does more than keep your books tidy. It changes how you relate to money.

Budget control starts with accurate income figures. When you know your actual monthly take-home, you can allocate money to rent, groceries, savings, and debt payoff with precision. Estimates lead to overspending; real numbers lead to real plans.

Man recording income in ledger at home office

Tax readiness is one of the most practical payoffs. U.S. sole proprietors report self-employment income on Schedule C, which requires a complete record of gross receipts. Missing deposits or unmatched 1099s are among the most common triggers for IRS notices. Keeping organized records throughout the year means tax season is a review, not a rescue operation.

Infographic illustrating 5 steps of income tracking benefits

There’s a psychological benefit too. According to a QuickBooks survey summarized by InfluenceFlow, 78% of freelancers reported less tax-related stress when they maintained good income tracking habits. That number reflects something real: clarity reduces anxiety. When you can answer “Can I afford this?” with data instead of a guess, financial decisions feel less stressful.

Regular tracking also helps you spot anomalies early — a missing deposit, a duplicate charge, or an unexpected dip in a revenue stream. Catching those early protects your finances before small problems compound.

  • Improved savings: You can only save consistently when you know what’s left after real expenses.
  • Debt payoff: Accurate income data helps you find extra dollars to direct toward balances.
  • Forecasting: Tracking over several months reveals patterns — seasonal dips, growth trends, and income floors.

2. What exactly should you track?

The goal isn’t to record every penny forever. It’s to capture enough detail that your records stay useful for budgeting and tax purposes.

Core items to record every month:

  • Gross salary or wages (before deductions)
  • Net pay (after taxes and benefits — your actual deposit)
  • Freelance or contract payments
  • 1099 income from any platform or client
  • Dividends and investment distributions
  • Rental income
  • One-time payments (bonuses, gifts, settlements)
  • Reimbursements (business expenses paid back by a client or employer)
  • Transfers from savings or other accounts (label these clearly — they are not income)

Gross vs. net: when to track which. Track gross income for tax planning, since that’s what the IRS sees. Track net income for cash-flow budgeting, since that’s what actually hits your account. Ideally, record both.

Source-level tracking vs. aggregated totals. If you have one employer and one paycheck, a single monthly total is fine. If you have multiple streams — a day job, a side client, and a rental — tracking by source lets you see which activities are actually profitable and which ones cost more than they earn. Aggregated totals hide that picture.

A practical framework: Sources → Categories → Tags. Assign each payment a source (who paid you), a category (salary, freelance, rental), and a tag for any special context (project name, property address, platform). This structure scales as your income grows more complex.

Pro Tip: Tag small or irregular streams the moment they arrive. A $200 payment from a new client is easy to forget by month-end. One quick label when you log it saves you 20 minutes of detective work later.

Tracking depth levels:

  1. Minimal: Total monthly deposits, labeled by source.
  2. Recommended: Gross and net per stream, monthly, with source tags.
  3. Granular: Per-project or per-property profit, with direct expenses assigned to each stream.

3. How to track your income: from notebook to automation

The best method is the one you’ll actually use. Start simple and upgrade when your income complexity demands it.

Method Best for Effort Limitations
Notebook / paper log Beginners, single income source Very low Hard to search; no calculations
Single spreadsheet 1–3 income sources, tech-comfortable Low Manual entry; no bank sync
Categorized spreadsheet Multiple streams, freelancers Medium Still manual; formulas help
Bank aggregation app Anyone with multiple accounts Low (after setup) May batch deposits; needs reconciliation
Dedicated finance app Variable income, gig workers, couples Low ongoing Subscription cost for premium features

Hands typing on laptop for automated income tracking

Starting manually is fine. A single Google Sheets tab with columns for date, source, gross amount, net amount, and category covers most people’s needs in the first month. No formulas required.

Scaling with spreadsheets means adding a category column, a tag column, and a simple SUMIF formula to total each stream. This takes about 30 minutes to set up and saves hours of mental math over the year.

Automated bank aggregation pulls transactions directly from your accounts. The catch: payment processors like PayPal or Stripe often batch multiple transactions into one deposit, so you still need to reconcile the deposit against your invoice records to maintain source-level visibility.

Dedicated finance apps handle the aggregation and add tagging, budgeting, and reporting on top. For anyone with variable income or more than two streams, the time savings are significant. For a comparison of budgeting and expense tracking apps, the key features to look for are bank sync, custom tags, and per-category reporting.

Recommended check schedule:

  1. Daily (2 minutes): Log any payment received the same day it arrives.
  2. Weekly (10 minutes): Reconcile your log against your bank statement; flag any gaps.
  3. Monthly (30 minutes): Run a source-level summary, compare to the prior month, and update your budget baseline.

4. How income tracking feeds your budget

Tracked income is the foundation of a budget that works. Without it, you’re allocating money you may not have.

Building a cautious baseline. For variable or gig income, track your low, average, and high months over at least three months. Then build your budget around the low figure. Recurring commitments — rent, utilities, loan payments — must be covered even in your worst month.

Sample budget calculation for variable income:

Month Gross income Net income
February $2,480
Cautious baseline $2,480

Budget your fixed expenses against the cautious baseline ($2,480 net in this example). Any month you earn above that floor, the surplus goes into a buffer account first, then toward savings goals or one-time costs.

Allocating recurring vs. flexible spending. Fixed commitments (rent, insurance, minimum debt payments) come off the top of your cautious baseline. What’s left is your flexible budget for food, transport, and discretionary spending. Converting irregular payments to monthly equivalents — for example, a quarterly freelance retainer divided by three — keeps your monthly picture accurate.

Pro Tip: When a high-income month arrives, move the surplus to a separate buffer account before you spend it. Treat it as invisible until your fixed expenses are covered for the next slow month.


5. Common income tracking mistakes and how to fix them

Most tracking systems break down in predictable ways. Here are the five most common errors and their fixes.

  • Treating income as fixed. Salaried workers sometimes skip tracking because they assume their pay never changes. But bonuses, overtime, tax withholding adjustments, and benefit changes all affect net pay. Fix: log every deposit, even when you expect it to be the same.

  • Lumping all income into one category. A single “income” line tells you nothing about which streams are growing and which are shrinking. Fix: assign a source tag to every payment from day one.

  • Mixing business and personal money. This is especially common for freelancers and sole proprietors. When business and personal transactions share an account, it’s nearly impossible to calculate profit per stream or prepare an accurate Schedule C. Fix: open a dedicated business checking account, or at minimum use strict tags to separate the two in your records.

  • Tracking revenue without assigning direct expenses. Knowing you earned $2,000 from a client project is only half the picture if you spent $600 on tools and software to complete it. Profit per stream — not gross revenue — reveals which activities actually fund your goals.

  • Ignoring red flags. Missing deposits, mismatched 1099 amounts, and unexplained gaps in your log are signals that your system has a hole. Check your records against your 1099s every January before filing.

The most expensive tracking mistake isn’t a wrong number — it’s a missing one. A deposit you forgot to log doesn’t just distort your budget; it can create a mismatch with IRS records that costs you time and money to resolve. Build the habit of logging income the day it arrives, and reconcile weekly so nothing slips through.


6. What research and practitioners say about income tracking

The evidence for consistent tracking is clear, and the U.S. tax context makes it essential for self-employed individuals.

A QuickBooks survey summarized by InfluenceFlow found that 78% of freelancers reported less tax-related stress when they maintained good income tracking habits. That’s not a small effect. Tax anxiety is one of the most common financial stressors for gig workers, and organized records are the most direct remedy.

For U.S. sole proprietors, the IRS requires self-employment income to be reported on Schedule C. This form asks for gross receipts, returns, and the cost of goods sold — all figures that require source-level records, not just a bank total. Practitioners consistently note that the most common Schedule C errors come from missing income entries, not from complex deductions.

Key practitioner takeaways:

  • Track low, average, and high income ranges over at least three months before setting a budget baseline.
  • Assign direct expenses to each income stream to calculate true profit, not just revenue.
  • Reconcile your records against bank deposits monthly to catch batching errors from payment processors.
  • Save all pay stubs and payment confirmations; monthly reconciliation is the simplest way to stay current.
Tracking behavior Reported benefit
Good income tracking habits 78% of freelancers reported less tax-related stress
Monthly reconciliation Reduces missed deposits and 1099 mismatches
Source-level tagging Enables profit-per-stream analysis
Cautious baseline budgeting Covers fixed costs even in low-income months

For a deeper look at how expense tracking best practices connect to income management, the Valapoint blog covers the full workflow for ages 18–45.


7. A practical 30-day plan to start tracking your income

You don’t need a perfect system on day one. You need a system you’ll actually use.

Week 1: Set up your foundation

  1. Open a spreadsheet (Google Sheets or Excel) with five columns: Date, Source, Gross Amount, Net Amount, Category.
  2. List every income source you currently have — job, freelance clients, platforms, rental, investments.
  3. Assign a short tag to each source (e.g., “Day Job,” “Client A,” “Rental 1”).
  4. Log all income received in the past 30 days from memory and bank statements.
  5. If you’re self-employed, open or designate a separate account for business income.

Week 2: Build the daily and weekly habit

  1. Log every payment the day it arrives — amount, source, and whether it’s gross or net.
  2. At the end of each week, compare your log to your bank statement and flag any gaps.
  3. Note any batched deposits from payment processors and break them down to the source level.
  4. Save or scan any pay stubs, invoices, or payment confirmations.

Week 3: Add depth and run your first report

  1. Add a column for direct expenses tied to each income stream.
  2. Calculate gross income and net income per source for the month.
  3. Identify your low, average, and high income figures across the streams you’ve tracked.
  4. Tag any one-time payments separately so they don’t inflate your baseline.

Week 4: Connect tracking to your budget

  1. Set a cautious budget baseline using your lowest monthly net income figure.
  2. Allocate fixed expenses first; assign the remainder to flexible spending categories.
  3. Move any surplus from above-baseline months to a buffer account.
  4. Schedule a recurring 30-minute monthly review in your calendar.

Pro Tip: The most common startup problem is falling behind after a busy week. If you miss a few days, don’t restart from scratch. Just log what you can from your bank history and keep going. An imperfect record is far more useful than no record.


Key Takeaways

Tracking your income consistently is the single most direct way to improve budget accuracy, reduce tax stress, and build financial confidence over time.

Point Details
Track gross and net separately Gross income supports tax planning; net income drives your actual budget.
Use source-level tags Tagging each payment by source reveals which streams are profitable and which aren’t.
Build from a cautious baseline Budget fixed expenses against your lowest monthly income to stay covered in slow months.
78% of freelancers reported less tax-related stress Freelancers with good tracking habits experienced less tax anxiety, according to a QuickBooks survey summarized by InfluenceFlow.
Valapoint automates the habit Valapoint’s Vala app syncs accounts, tags income streams, and surfaces spending patterns so your 30-day plan runs on autopilot.

The habit matters more than the system

Most financial advice focuses on the mechanics of tracking — which app, which spreadsheet, which formula. That’s useful, but it misses the bigger point.

The real value of tracking your income isn’t the spreadsheet. It’s the shift in how you make decisions. When you know your numbers, you stop reacting to money and start directing it. You negotiate from a position of knowledge. You don’t panic when a slow month arrives because you’ve already planned for it.

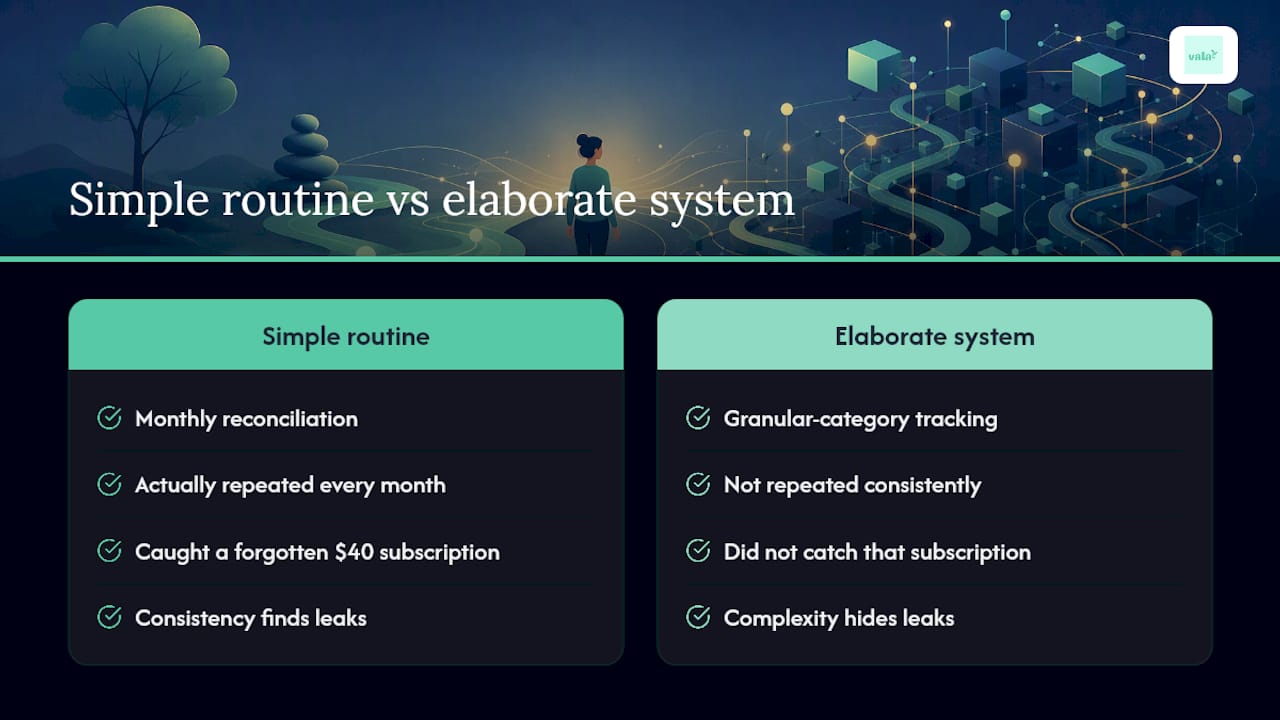
The readers who get the most out of income tracking aren’t the ones with the most sophisticated systems. They’re the ones who check in regularly, even when the numbers aren’t great. Consistency beats complexity every time. Start with a single spreadsheet column and one weekly check-in. That’s enough to change how you relate to your finances.


Vala makes income tracking a habit you’ll actually keep

Most people know they should track their income. The gap is between knowing and doing. Vala closes that gap by handling the parts that usually cause people to quit: manual entry, forgotten streams, and the effort of running reports.

Valapoint

With Vala, you connect your bank accounts once and the app automatically categorizes income by source, flags unusual deposits, and shows you a real-time view of what’s coming in across every stream. The tagging system mirrors the Sources → Categories → Tags framework described above, so your 30-day plan translates directly into the app. Bill reminders and recurring subscription reviews mean nothing slips through, and the AI-powered insights surface patterns you’d miss in a spreadsheet.

Whether you’re salaried, freelancing, or managing a mix of both, Vala’s personal finance app gives you the clarity to budget confidently and the records to make tax season straightforward. Start with the free plan and upgrade when you’re ready for advanced reporting and goal tracking.


Useful sources and further reading

Authoritative U.S.-focused resources used in this article:

  • IRS Schedule C (Form 1040) — About Schedule C: Official IRS guidance on reporting self-employment income and deductions for sole proprietors.
  • FHI 360 / CFPB-style income tracking guide: Classroom-tested exercises on converting irregular pay to monthly equivalents and building variable-income budgets.
  • Crown Financial Ministries — How to track your income: Practical guidance on saving pay stubs, monthly reconciliation, and budgeting from your lowest income month.
  • InfluenceFlow — Track your earnings effectively: Source for the QuickBooks freelancer survey data on tax stress reduction and the Sources → Categories → Tags framework.
  • Rising & Thriving — How to track multiple income streams: Detailed guidance on batched deposits, source-level visibility, and per-stream profit tracking.
  • MoneyLooms — A simple guide to tracking your income: Recommendations for monthly review cadence and low/average/high income range tracking.

Valapoint internal resources:

  1. Expense tracking best practices for ages 18–45 — Practical onboarding tips and habit advice aligned with the 30-day plan above.
  2. Where is my money going? Understanding your expenses — Connects income tracking to expense tagging and profit-per-stream analysis.
  3. Personal finance tools: budget, savings, and debt calculators — Quick utilities for building budget baselines from your tracked income figures.

How Expense Insights Work: AI-Powered Spending Signals

Expense insights are saved, pre-built analytics queries that automatically group your transactions, compute totals, and surface spending patterns in near real time. Three things define how they work: (1) they refresh as transactions change — every edit, approval, or new import recalculates the card instantly; (2) their accuracy depends entirely on categorization and data model quality; and (3) AI layers on top to add forecasts, anomaly flags, and plain-language explanations that plain aggregations cannot produce.

  • Insights stay current without you rerunning anything — the query is always live.
  • Garbage categories produce garbage insights; fixing one merchant match can correct an entire month’s breakdown.
  • AI outputs (summaries, anomalies, forecasts) are built on the same grouped data, just interpreted by a model.

Table of Contents

How do expense insights actually work?

Every insight card you see is the output of a five-step pipeline running behind the scenes.

Data ingest is where it starts. Your bank and credit card feeds sync automatically, manual entries fill the gaps, and shared group items get tagged to specific members. All of that raw data flows into a single ledger.

Normalization cleans the mess. Raw bank descriptions are inconsistent — the same coffee shop might appear as “SQ *BLUESTONE LN,” “BLUESTONE LANE NYC,” or a truncated string. The app standardizes merchant text, attaches timestamps, and normalizes any currency differences so every record is comparable.

Categorization is the most consequential step. Transaction categorization maps those cleaned descriptions to spending categories — groceries, dining, transport, subscriptions — using a combination of machine learning and rules, often with a confidence score attached. A high-confidence match goes straight through; a low-confidence one may surface for your review.

Hands pointing at transaction categorization documents

Aggregation is where the insight card is actually built. Grouping operators like group-by:category, group-by:merchant, and group-by:month compute totals and counts, then rank groups by value. A simple monthly category drift query combines group-by:month with group-by:category to show you exactly where spending shifted.

Infographic illustrating expense insight pipeline steps

Presentation delivers the result as a card, chart, or drilldown. The query stays live, so the card updates the moment a new transaction posts or you correct a category.

Pipeline Step What Happens What You Can Influence
Data ingest Bank/card feeds sync; manual entries added Connect all accounts; add receipts promptly
Normalization Merchant text cleaned; timestamps attached Correct merchant names when misread
Categorization ML + rules map transactions to categories Recategorize mismatches; teach the model
Aggregation Totals, counts, and rankings computed by dimension Set consistent “who” tags for group members
Presentation Live insight card rendered; drilldown available Drill into any group to verify the numbers

A reliable data model separates aggregatable facts (dollar amounts) from contextual entities (items, reports, timestamps). Without consistent “who” and “date” fields, the aggregations lose meaning fast.

What does AI add to your expense insights?

Plain aggregations tell you what happened. AI tells you why and what’s coming.

  • Summary generation: A short natural-language highlight like “Groceries up 18% vs. last month” appears at the top of the card, pulling the most significant trend so you don’t have to scan a table.
  • Anomaly detection: The model flags unusual spikes or out-of-pattern items and surfaces the likely cause — a specific merchant, a time cluster, or a single group member. AI-powered anomaly detection catches what manual review misses.
  • Forecasting: Short-term projections use your historical patterns and seasonal signals to estimate where a category is heading. Zoho Expense documents AI features that forecast future expenses and visualize trends as charts.
  • Spending explainers: The AI decomposes a change versus a rolling baseline and links directly to the supporting transactions, so you can verify the claim in two taps.

All four features sit on top of the same grouped aggregations used for basic insights. The AI is an interpretation layer, not a separate data source.

Pro Tip: Some AI features — including forecasting and advanced anomaly detection — may need to be enabled in your app’s settings before they appear on your dashboard. Check your notification and AI preferences if a feature you expect isn’t showing up.

What insight cards and metrics will you actually see?

Recognizing the standard card types helps you use them correctly instead of misreading what they show.

Insight Card Key Metric Useful For Dimensions That Power It
Period total Total spend for month/week/quarter Budget pacing, month-end check Time, person
Category breakdown Spend per category, ranked Spotting category drift, finding leaks Category, time
Top merchants Highest-spend vendors Identifying subscriptions, duplicate charges Merchant, time
Status breakdown Submitted / approved / reimbursed counts Tracking reimbursements in shared groups Status, person
vs. Budget Actual vs. budgeted per category Enforcing shared-budget limits Category, budget baseline
Per-person split Each member’s share of group spend Fairness checks, group reconciliation Person (who), time
Month-over-month change % change vs. prior period Catching unexpected spending jumps Time, category or merchant

Common analytics views include period totals, status breakdowns, and actual-vs.-budget comparisons. The per-person split card is especially useful for couples or small groups where one member’s spending can quietly skew the whole picture.

How can you get more reliable insights from your app?

Better inputs produce better outputs. These five steps make the biggest difference.

  1. Connect and authorize all bank and credit card feeds. Missing accounts create blind spots. A partial picture produces misleading totals.
  2. Confirm and correct category mappings. Review auto-assigned categories for the first two weeks after connecting an account. Expense categorization accuracy improves significantly once you correct the early mismatches.
  3. Set budgets and comparison baselines. Without a baseline, the vs.-budget card has nothing to compare against. Even a rough monthly target per category is enough to activate the comparison view.
  4. Enable shared-group tagging. Assign a “who” field to each member so the per-person split and top-spender cards stay meaningful across periods.
  5. Reconcile receipts and approve transactions. Status fields only populate when transactions move through the workflow. Unreconciled items skew status breakdowns and reimbursement tracking.

Example: Say your app keeps categorizing a local gym as “Health & Fitness” one month and “Subscriptions” the next. Correcting that merchant match once teaches the model. The category-breakdown card for every prior month that included that merchant recalculates automatically.

Pro Tip: Use custom tags for recurring shared costs — a road trip, a joint subscription, a group dinner — so you can filter insights by event without disrupting your main category structure.

What are the limits of expense insights, and how do you verify them?

Insights can mislead you in a few specific ways. Knowing the failure modes helps you catch them before acting.

The most common pitfalls: miscategorized transactions inflate the wrong category; missing bank connections leave whole accounts out of totals; multi-currency transactions distort period comparisons if exchange rates aren’t normalized; and timing mismatches between transaction date and settlement date can make a charge appear in the wrong month.

When a number looks off, open the drilldown. Grouped insights rank groups by value and let you expand any group to see the individual transactions behind it. Check the “who” filter and the time range first — a wrong date filter is the most common reason a total looks wrong. Then reconcile any suspicious spike against your actual bank statement or receipt.

On privacy: before enabling group insights, review your app’s bank-connection permissions and sharing settings. Understand exactly which members can see which transactions, especially in a shared household or friend group where some spending is personal.

Pro Tip: Treat any insight that would drive a big decision — canceling a service, reallocating a joint budget, or making a large transfer — as a hypothesis, not a verdict. Drill down to the supporting transactions before you act.

How Vala puts expense insights to work for you

Valapoint’s Vala app walks you through the full insight flow in a few taps. The dashboard shows insight cards for your connected accounts. Tap any card to expand the grouped view, sorted by value. Tap a group to see the individual transactions behind it. Open any transaction to view the receipt, edit the category, or correct the “who” field — and watch the insight card recalculate immediately.

Trust signals built into the experience: insights refresh in real time as transactions post, edits are logged in an audit trail, and bank-connection permissions are clearly displayed so you always know what data is being accessed. For couples and groups, Vala assigns a consistent “who” dimension to each member, handles split items with share tags, and supports per-member budgets so the top-spender card stays accurate across people and periods. Real-time group tracking is built into the core experience, not an add-on.

Pro Tip: After connecting your first account, correct one miscategorized transaction and watch the category breakdown card update. That single action shows you exactly how the insight pipeline responds to better data.

Key Takeaways

Expense insights are only as reliable as the data feeding them — connect every account, fix categories early, and always verify big signals with a drilldown before acting.

Point Details
Insights are live queries They recalculate automatically as transactions are added, edited, approved, or reimbursed.
Categorization drives accuracy Correcting one merchant match retroactively fixes every insight that included that transaction.
AI adds interpretation Summaries, anomaly flags, and forecasts layer on top of the same grouped data as basic cards.
Five steps improve reliability Connect all accounts, fix categories, set budgets, tag members, and reconcile receipts.
Valapoint’s Vala app Provides real-time insight cards, a full audit trail, and easy recategorization for individuals, couples, and groups.

When should you trust automated insights — and when should you check?

Automated insights are genuinely useful for routine monitoring. A weekly scan of your top-5 spending categories and any flagged anomalies takes 10–15 minutes and catches most drift before it becomes a real problem. For that kind of regular check-in, the AI’s work is usually good enough to act on directly.

Where I’d push back on full automation: any decision with real financial weight deserves a manual drilldown. Canceling a subscription, reallocating a joint budget, or deciding a category is “under control” based on a single card — those warrant opening the transaction list and confirming the numbers are clean. The insight is a prompt, not a conclusion.

The weekly review habit that works best focuses on two things: flagged anomalies first, then the top-5 spenders by category. Everything else can wait for month-end. That rhythm keeps insights honest without turning personal finance into a second job.

See your spending clearly with Vala

Most people don’t have a spending problem. They have a visibility problem. Vala’s AI-powered insight cards give you a clear, real-time picture of where your money goes — across your own accounts, a shared household, or a group of friends splitting costs.

Valapoint

Connect one bank account, correct one category, and your first insight card recalculates in front of you. That’s the fastest way to understand what the data actually shows. Vala’s audit trail, recategorization tools, and secure bank-connection controls mean you’re always in charge of what gets tracked and who sees it. Start with a free account and test your first insight today.

Useful sources

These references cover the technical foundations and practical setup steps behind expense insights.

  • How to Use Insights in Expensify — Documents how pre-built insight queries work, grouping operators available, and real-time refresh behavior.
  • Expense Analytics | Zoho Expense — Covers AI features including forecasting, anomaly detection, and chart-based visualization.
  • AI Features | Zoho Expense — Details which AI features require explicit enablement and early-access availability.
  • Automated Transaction Categorization | Fiskil — Explains how raw bank descriptions are mapped to categories with confidence scores.
  • Insights Data Model | MXP Help Center — Describes the structured data model that separates aggregatable facts from contextual entities.
  • Expense Analytics | Light Help Center — Lists common analytics views including period totals, status breakdowns, and budget comparisons.
  • Vala Blog: Expense Tracking Best Practices — Practical habits for consistent tracking and weekly insight reviews.

When following any verification step, open the drilldown or audit trail link in your app directly — reading the transaction list behind a number is always faster than second-guessing the card.

12 Examples of Financial Leaks in Everyday Spending

The biggest everyday financial leaks are unused subscriptions, delivery fees, daily coffee, impulse mobile purchases, overlapping streaming services, auto-renewals, bank fees, and convenience buys. Two fixes you can do right now: pull up your bank app and cancel one subscription you haven’t used this month, then switch your next food order to pickup. Those two moves alone can free up some extra cash before the week ends.

Small costs compound fast. One $4 daily drink adds up to roughly $1,020 a year, and most people have several habits running at that scale simultaneously. The math is the motivation.

Hands holding coffee cup at home office desk

Quick-action table — do these in the next 60 minutes:

Action Time needed Likely savings
Cancel one unused subscription 5 minutes a modest monthly amount
Switch one delivery order to pickup 2 minutes a modest saving per order
Turn off auto-renew on unused apps 10 minutes a modest monthly saving
Search statements for recurring charges 20 minutes Varies

Woman managing subscriptions on smartphone overhead view


Table of Contents

1. Zombie subscriptions you forgot you signed up for

You signed up for a free trial, the trial ended, and the charge quietly started. Survey evidence shows many adults carry at least one paid subscription they no longer use. Forgotten subscriptions can add up to a significant annual cost. Fix: search your bank statement for the word “subscription” and cancel anything you wouldn’t sign up for again at full price today.

2. Overlapping streaming services

Three streaming services at typical prices amount to a notable monthly cost. Most households actively watch one or two at a time. Rotate services: subscribe to one, finish what you want, cancel, then pick up the next. You lose nothing and save a modest amount monthly.

3. Food delivery fees and tips

Delivery fees and tips typically add a substantial percentage to the base restaurant price. A $20 meal can become notably more expensive after platform fees, service fees, and tips. Two deliveries a week at that markup cost significantly more per month compared to pickup. Switching even one of those orders to pickup each week yields meaningful savings.

4. Daily coffee and bottled drinks

A $4–$6 coffee every workday costs a notable monthly and annual amount source. Add a $2 bottled water or soda and the number climbs further. Brewing at home costs roughly $0.25–$0.50 per cup. You don’t have to quit coffee. Cutting from five days a week to two saves $40–$60 a month without much sacrifice.

5. Impulse mobile purchases

One-tap checkout on shopping apps removes almost all friction between wanting something and buying it. Small individual purchases feel insignificant alone, but multiple purchases each month can add up noticeably. Fix: log out of shopping apps after each session. The extra login step creates just enough pause to ask whether you actually need the item.

6. Buy-now-pay-later traps

Buy-now-pay-later plans feel free because the first payment is small. But stacking multiple plans means carrying a notable amount in automatic monthly deductions you’ve mentally filed as “already paid for.” Miss a payment and late fees apply. Treat each installment plan as a recurring charge and list them all in one place so you can see the real monthly total.

7. Shipping and fast-delivery upgrades

Paying a few dollars for two-day shipping on items you don’t urgently need is a common premium-tier habit that quietly raises your monthly baseline. Done multiple times a month, these fees add up for convenience you probably didn’t need. Batch your online orders and choose free standard shipping — most items arrive in three to five days anyway.

8. Bank fees, ATM fees, and overdraft charges

Out-of-network ATM fees and overdraft fees can be significant per occurrence. Bank fees quietly erode budgets for many consumers. Frequent ATM withdrawals from the wrong machine can cost a notable amount monthly. Fix: use your bank’s app to find in-network ATMs, or switch to an account with no ATM fees.

9. Convenience purchases — vending machines and grab-and-go snacks

A modestly priced vending machine snack twice a day at work can add up to a significant monthly expense. Packing snacks from home cuts that to nearly zero. Extension-based budgeting resources consistently flag convenience food as one of the most underestimated daily spending leaks because each purchase feels too small to matter.

10. Frequent rideshares for short trips

Rideshares for short trips, taken multiple times per week, can amount to a notable monthly expense. For trips under two miles, walking or biking is free. For regular commutes, a monthly transit pass is almost always cheaper. Reserve rideshares for trips where no alternative exists.

11. Gym memberships and recurring memberships you don’t use

A gym membership with infrequent visits results in a high effective cost per visit. That’s not a fitness expense — it’s a guilt subscription. Either commit to a schedule or cancel and use free outdoor workouts or a pay-per-visit facility. The same logic applies to professional memberships, club dues, and loyalty programs with annual fees.

12. Premium app tiers and software upgrades

Paying a monthly fee for a premium tier of an app you use for one feature is a common budgeting mistake. Cloud storage upgrades, premium news subscriptions, and productivity app tiers all follow the same pattern. Audit each one: if you use only the basic features, downgrade. Most apps let you re-upgrade instantly if you need to.


How to find your own spending leaks in one session

The six-step audit: gather three months of statements, search for recurring charges, group food and delivery costs, flag frequent small items, check for bank fees, then annualize everything you flagged. Here’s how to move through each step.

Step 1 — Gather three months of statements (10 minutes). Download or print your bank and credit card statements for the past three months. You need all accounts, not just one card.

Step 2 — Search for recurring charges (15 minutes). Look for any charge that appears more than once. Search terms like “subscription,” “monthly,” “annual,” and merchant names help. Flag every charge you didn’t actively re-verify this month. Anything you wouldn’t sign up for again at full price today is a candidate for cancellation.

Step 3 — Group food, delivery, and convenience costs (10 minutes). Add up every restaurant, delivery app, coffee shop, and convenience store charge. Most people are surprised by the monthly total. This is your clearest quick-win category.

Step 4 — Flag frequent small items (10 minutes). Look for charges under $15 that appear four or more times a month. These are your habit leaks — the ones that feel trivial but compound fast. The spending insights guide on the Valapoint blog walks through how to interpret these categories.

Step 5 — Check bank and ATM fees (5 minutes). Search for “fee,” “overdraft,” and “ATM” in your statements. Any fee you paid in the last three months is likely recurring.

Step 6 — Annualize everything you flagged (10 minutes). Multiply each monthly charge by 12. This single step is what makes the math feel real. A $14 charge becomes $168; three of them become $504.

Total time: roughly an hour. Realistic first-month savings for most people who complete this audit and cancel a few items can be significant, based on practitioner guidance recommending targeted cancellations produce measurable monthly results. Valapoint’s app can auto-detect recurring charges and surface them in one view, which cuts the audit time significantly. You can also explore hidden monthly spending leaks with Valapoint’s step-by-step guide.


Practical fixes that actually stop leaks for good

Three anchor fixes address the root causes of most everyday spending leaks:

  1. Remove autopay from services you wouldn’t proactively re-subscribe to. Auto-renewals shift spending to autopilot and remove conscious choice. Turning them off forces a real decision each cycle.
  2. Replace delivery with pickup or batch cooking at least once a week. Pickup removes platform fees, service fees, and tip requirements entirely.
  3. Add a 24-hour wait rule for any unplanned purchase over $20. Most impulse buys feel unnecessary the next morning.

Behavioral fixes that stick:

  • Label a “habit cost” category in your budget and track it separately from planned spending.
  • Use commitment devices: a prepaid coffee card limits daily spend without requiring willpower each morning.
  • Log out of shopping apps after every session to restore friction before purchases.
  • Schedule a 15-minute subscription review on the first of every month as a recurring calendar event.

Technical fixes:

  • Turn off auto-renew on every subscription. Re-subscribe manually when you actually want to continue.
  • Set price-tracking alerts on items you plan to buy so you stop paying full price on impulse.
  • Call or chat your internet, phone, or insurance provider once a year and ask for a loyalty rate. Many providers offer one without advertising it.
  • Downgrade premium app tiers to free or basic when you use only standard features.

Pro Tip: When canceling a subscription by phone, use this script: “I’d like to cancel my account. I’m not using it enough to justify the cost.” If they offer a discount, ask for it in writing before agreeing. If they don’t, confirm the cancellation date and ask for a confirmation email.

Switching a few food deliveries a month to pickup saves a modest amount in fees and tips alone, based on the typical markup that delivery platforms add to base prices. This adds up to meaningful annual savings from one habit change.

Spending triggers — emotional states, boredom, social cues — drive many of these purchases. Recognizing your personal triggers is the first step to interrupting the pattern. Finance automation can also help by removing the manual effort from good habits like saving and bill tracking.


The math that makes small habits feel real

Two deliveries a week plus a daily coffee totals a substantial amount annually. Here’s the breakdown:

Habit Monthly cost Annual cost
$5 coffee, 20 workdays/month $100 $1,200
Food delivery x2/week (fees + tip included) a considerable monthly and annual cost
3 streaming services at $14/month each $42 $504
2 forgotten subscriptions at $12/month each $24 $288
ATM fees, 2x/week out-of-network a moderate monthly and annual cost

The daily habit cost calculator shows that delivery fees and tips alone can add 40–60% to the base meal price, which is why delivery frequency is the highest-leverage habit to change.

Simple rule of thumb: unit cost × times per week × 52 = annual cost. For example, a $5 daily coffee across 20 workdays a month equals $1,200 a year, and a $6 coffee three times a week costs $936 a year. A $4 vending snack twice a day at work costs $2,080 a year. Run this formula on your top three habits and the number usually surprises you.

For a deeper look at how these patterns interact, the spending insights guide explains how categorizing habits reveals which ones are actually driving your monthly total.


When leaks keep coming back — and what that signals

Two clear signals that your leaks point to something bigger than a subscription problem:

  • Leaks return within weeks of fixing them. You cancel three subscriptions, then sign up for two new ones the following month. The behavior pattern is the issue, not the specific charges.
  • Debt is growing even after you’ve made fixes. If your balance is climbing despite cutting costs, your income and expenses are misaligned at a structural level.

What to do next:

  • Build a $500–$1,000 emergency buffer first. Without one, unexpected expenses force you back into debt or overdraft, which creates new fees and undoes your progress.
  • Set a 30-day behavior challenge: pick two specific leaks and track them daily for one month. Short, focused challenges work better than broad resolutions.
  • If debt is rising, get a free credit counseling session. The National Foundation for Credit Counseling (NFCC) connects U.S. consumers with nonprofit counselors at no cost.
  • If income is the core problem, a spending audit alone won’t solve it. A counselor can help you build a realistic plan that accounts for both sides of the equation.

Behavioral finance research shows that emotional and habit-driven purchases bypass deliberate cost-benefit thinking. That’s why the same leaks reappear: the trigger hasn’t changed, only the specific charge. Addressing the trigger — boredom, stress, social pressure — is what produces lasting change.

This article is general financial information, not professional advice. For debt, credit, or tax situations specific to your circumstances, consult a qualified financial professional or visit NFCC.org.


Key Takeaways

Fixing everyday financial leaks is primarily a habit problem: identifying and canceling three to five recurring charges after a one-session audit produces measurable savings within the first month.

Point Details
Top leaks to fix first Unused subscriptions, delivery fees, and daily coffee are the highest-frequency, easiest-to-cut leaks.
Coffee and delivery math A daily $5 coffee totals $1,200 a year; combined with two weekly deliveries, yearly costs can easily surpass $2,000.
Audit method A 60-minute, three-month statement review surfaces the biggest leaks and realistic cancellation targets.
Behavioral root cause Leaks that return after fixes signal a spending trigger, not just a budget gap — address the habit, not just the charge.
Valapoint for faster audits Valapoint auto-detects recurring charges and habit categories, cutting audit time and surfacing leaks you’d likely miss manually.

Saving is a habit problem, not just a math problem

Most budgeting advice treats financial leaks as a calculation error. Fix the numbers, problem solved. But the math is rarely the hard part. You already know that daily coffee adds up. The reason it keeps happening is that spending decisions are made on autopilot, not after deliberate thought.

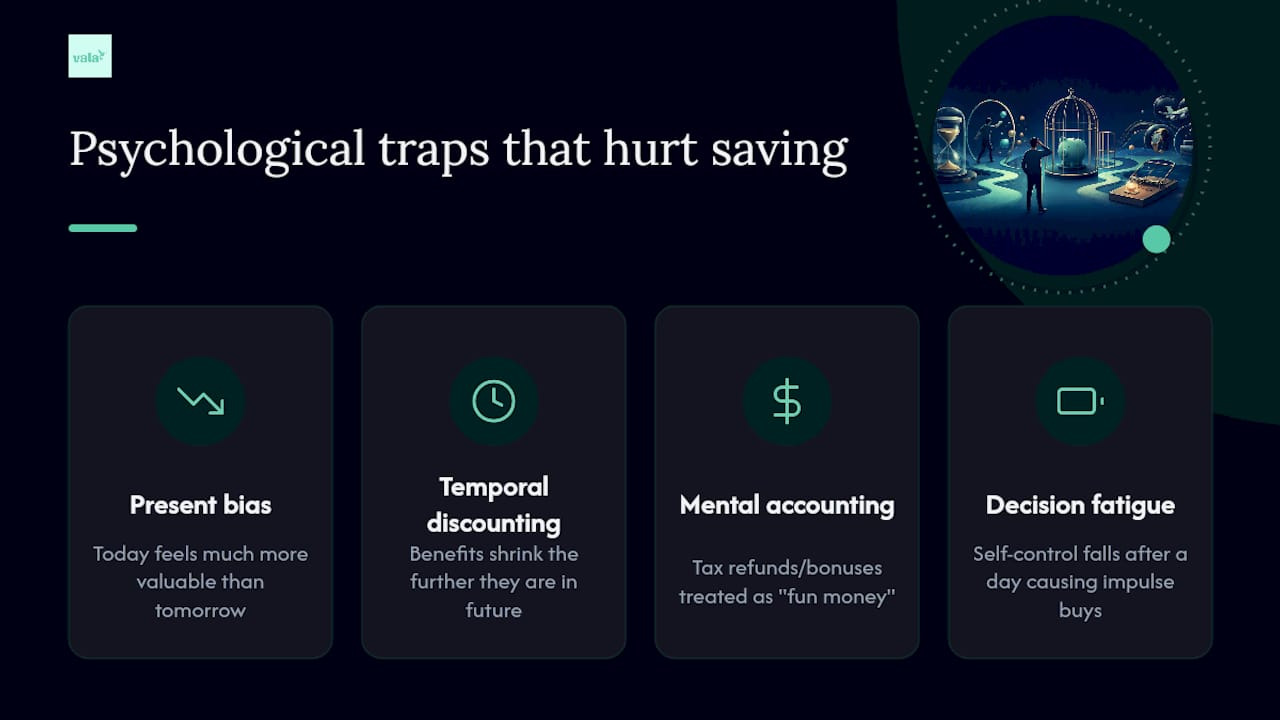
Behavioral finance has a name for this: present bias. Small, immediate pleasures feel more real than abstract future savings. A $5 coffee right now is concrete. The $1,200 it costs annually is theoretical. The brain consistently chooses concrete over theoretical, which is why willpower-based budgeting fails so often.

What actually works is changing the environment, not the intention. Remove the friction from saving and add it back to spending. Log out of shopping apps. Turn off auto-renew. Set a 24-hour rule. These aren’t deprivation strategies — they’re decision-architecture adjustments that make the default behavior the better one.

Pick two leaks from this list, not twelve. Address them for 30 days. That’s a realistic, sustainable starting point. The psychology behind everyday spending confirms that labeling habit spending and scheduling deliberate reviews reintroduces conscious choice into decisions that have become automatic. Your financial DNA — your personal spending style — shapes which leaks hit you hardest, and knowing that pattern is half the fix.


Valapoint helps you spot and stop everyday leaks automatically

Valapoint’s highest-value capability for this reader is simple: it automatically detects recurring charges and surfaces high-frequency spending habits in one clear view, so you don’t have to spend an hour combing through statements.

Valapoint

Here’s how Valapoint’s features map directly to the audit and fixes in this article:

  • Recurring charge detection — flags every subscription and auto-renewal across connected accounts, including ones you’ve forgotten about.
  • Subscription review — groups all recurring charges in one place so you can cancel or downgrade without hunting through multiple statements.
  • Habit-category tracking — automatically tags coffee shops, delivery apps, and convenience purchases so you can see your monthly total at a glance.
  • Delivery and merchant tagging — identifies high-fee merchants and delivery platforms so you can see exactly how much the markup is costing you.
  • Bill reminders — alerts you before charges hit so you can cancel before the next billing cycle instead of after.
  • Savings goal automation — moves money toward a goal automatically, so the savings happen before you have a chance to spend it.

To run the six-step audit faster, connect your accounts in Valapoint and let the recurring-charge detection do steps two and five for you. The habit categories handle step three. You’re left with the decisions, not the digging.

Ready to see where your money is actually going? Try the Valapoint personal finance app and get a clear picture of your spending leaks in minutes.


Useful sources and further reading

  • Plugging Spending Leaks — UF/IFAS Extension Wakulla County — Community-level budgeting guide covering daily coffee, takeout, and forgotten subscriptions as top everyday leaks.
  • These 8 Hidden ‘Money Leaks’ Could Be Draining Thousands — AARP — Consumer-facing overview of unused subscriptions and bank fees, with prevalence data for U.S. adults.
  • The Top Spots Where Your Money Is Leaking Each Month — Yahoo Finance — Expert-sourced guide on auto-renewals, zombie subscriptions, and the three-month retrospective audit method.
  • Top Spots Your Money Is Leaking — GoBankingRates — Credit industry expert commentary on how premium tiers and incremental upgrades raise monthly baselines over time.
  • What Do Your Daily Habits Actually Cost You? — UseACalculator — Habit cost calculator and examples showing delivery fee markups and 10-year projections for common daily purchases.
  • 6 Bad Spending Habits to Avoid — Nationwide — Practical examples including the $4 daily coffee calculation ($1,020/year) and home-brew cost comparisons.
  • The Psychology Behind Everyday Money Decisions — Kalkine Education — Behavioral finance review covering present bias, emotional triggers, and how habit spending bypasses deliberate decision-making.
  • Managing Your Money — Stop Spending Leaks? — NMSU Extension — University extension circular with structured guidance on identifying and reducing spending leaks for U.S. households.
  • 5 Budgeting Apps Compared by Bank-Data Privacy — Obsidian Ridge Labs — Third-party analysis of privacy considerations when choosing a personal finance app; useful for readers evaluating secure tools.